import pandas as pdThe Portal Project data
d = pd.read_csv('data/portal_project.tsv', delimiter='\t')Create separate tables
species = d.copy()[['species_id', 'species', 'genus', 'taxa']]
species = species.drop_duplicates()

species1 = d.copy()[['species_id', 'species', 'genus', 'taxa']].drop_duplicates()

observations = d.copy().drop(columns=['species', 'genus', 'taxa'])
Average hindfoot length per species
average_length = observations.hindfoot_length.mean(skipna=True) # skipna=True is also the defaultaverage_length29.287931802277498average_length_ps = observations.groupby('species_id', as_index=False).\
agg(mean_hf_length = ('hindfoot_length', 'mean')).\
merge(species, how='inner')
average_length_ps.head()| species_id | mean_hf_length | species | genus | taxa | |
|---|---|---|---|---|---|
| 0 | AB | NaN | bilineata | Amphispiza | Bird |
| 1 | AH | 33.0 | harrisi | Ammospermophilus | Rodent |
| 2 | AS | NaN | savannarum | Ammodramus | Bird |
| 3 | BA | 13.0 | taylori | Baiomys | Rodent |
| 4 | CB | NaN | brunneicapillus | Campylorhynchus | Bird |
Ratio M/F per species per year
ratios = observations.\
    groupby(['species_id', 'year', 'sex'], as_index=False).\
    agg(nr = ('record_id', 'count')).\
    pivot(index = ['species_id', 'year'], columns = 'sex', values = 'nr')
ratios['mfratio'] = ratios.M / ratios.F
ratios = ratios.reset_index()ratios.head()| sex | species_id | year | F | M | mfratio |
|---|---|---|---|---|---|
| 0 | AH | 1995 | NaN | 1.0 | NaN |
| 1 | BA | 1989 | NaN | 3.0 | NaN |
| 2 | BA | 1990 | 8.0 | 3.0 | 0.375000 |
| 3 | BA | 1991 | 19.0 | 6.0 | 0.315789 |
| 4 | BA | 1992 | 4.0 | 2.0 | 0.500000 |
Number of observations per species and year
obspspy = observations.\
groupby(['species_id', 'year'], as_index=False).\
agg(obs = ('record_id', 'count'))
obspspy['totobs'] = obspspy.groupby('species_id').obs.transform('sum')
obspspy = obspspy[obspspy.totobs > 300].\
merge(species, how='inner')
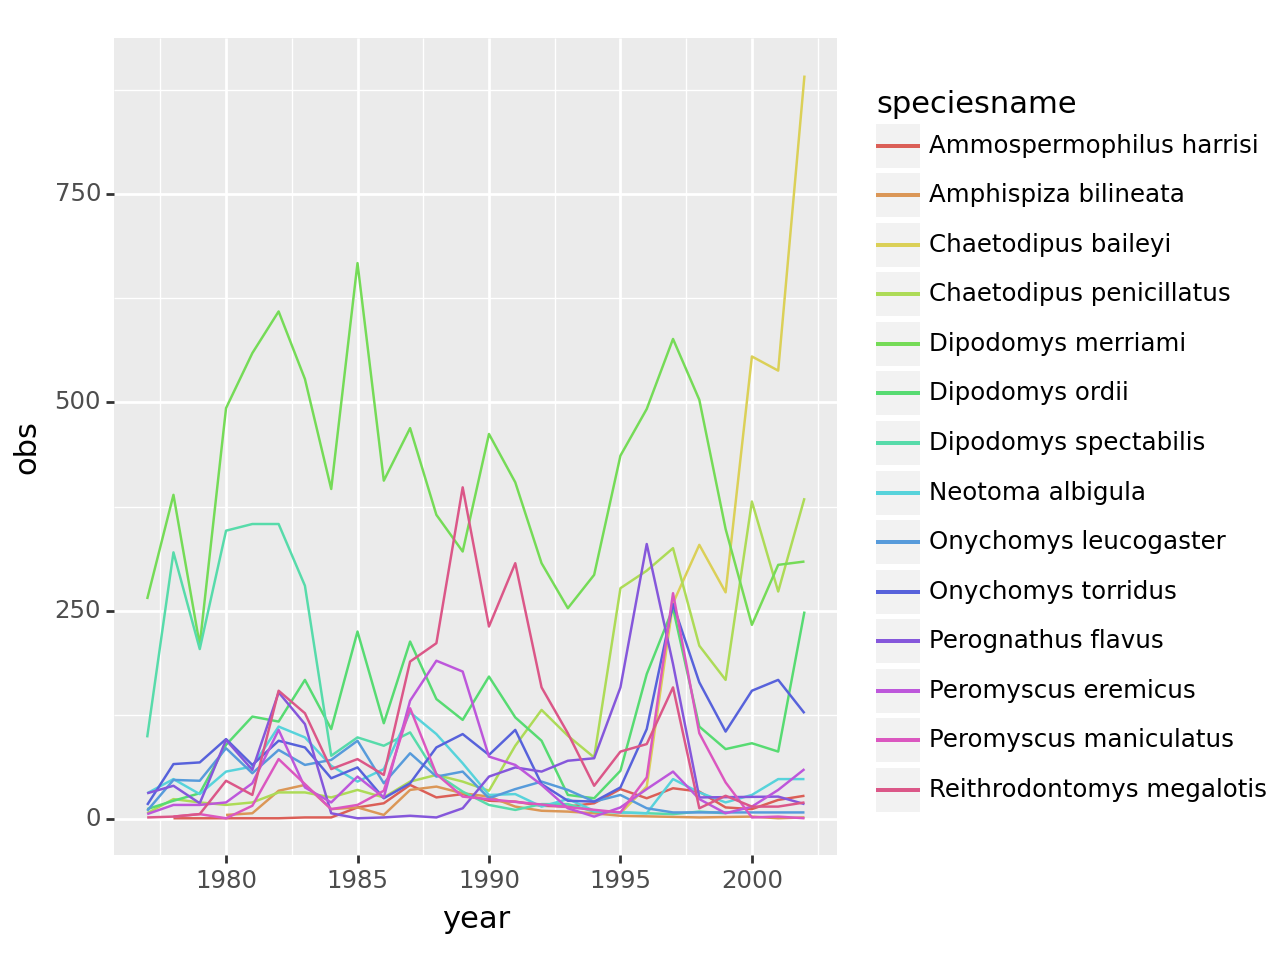
obspspy['speciesname'] = obspspy.genus + ' ' + obspspy.speciesMake a plot
import plotnine as p9(
p9.ggplot(obspspy, mapping=p9.aes(x='year', y='obs', color='speciesname'))
+ p9.geom_line()
)
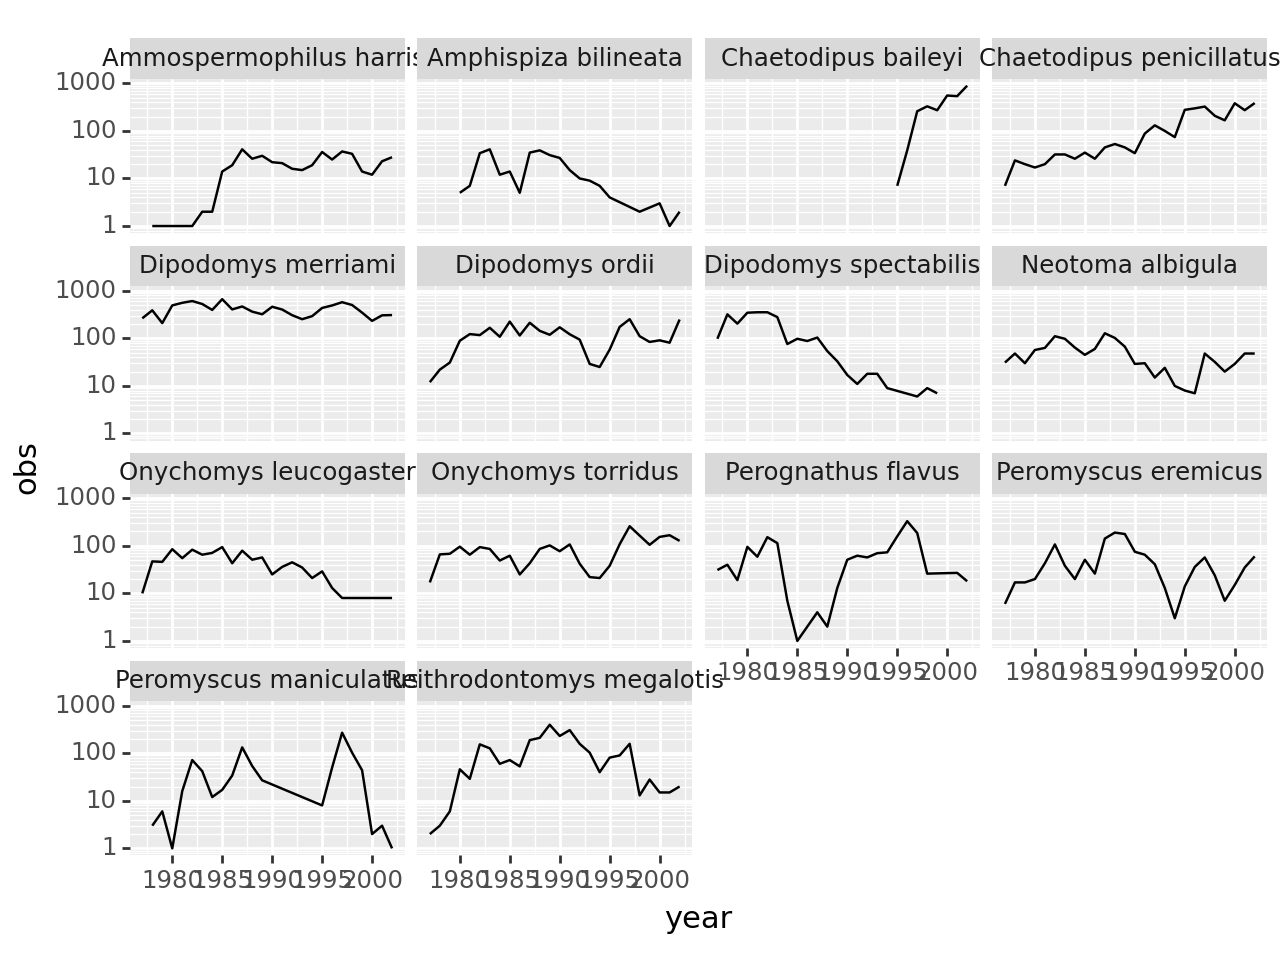
(
    p9.ggplot(obspspy, mapping=p9.aes(x='year', y='obs'))
    + p9.geom_line()
    + p9.facet_wrap('speciesname')
    + p9.scale_y_log10()
)